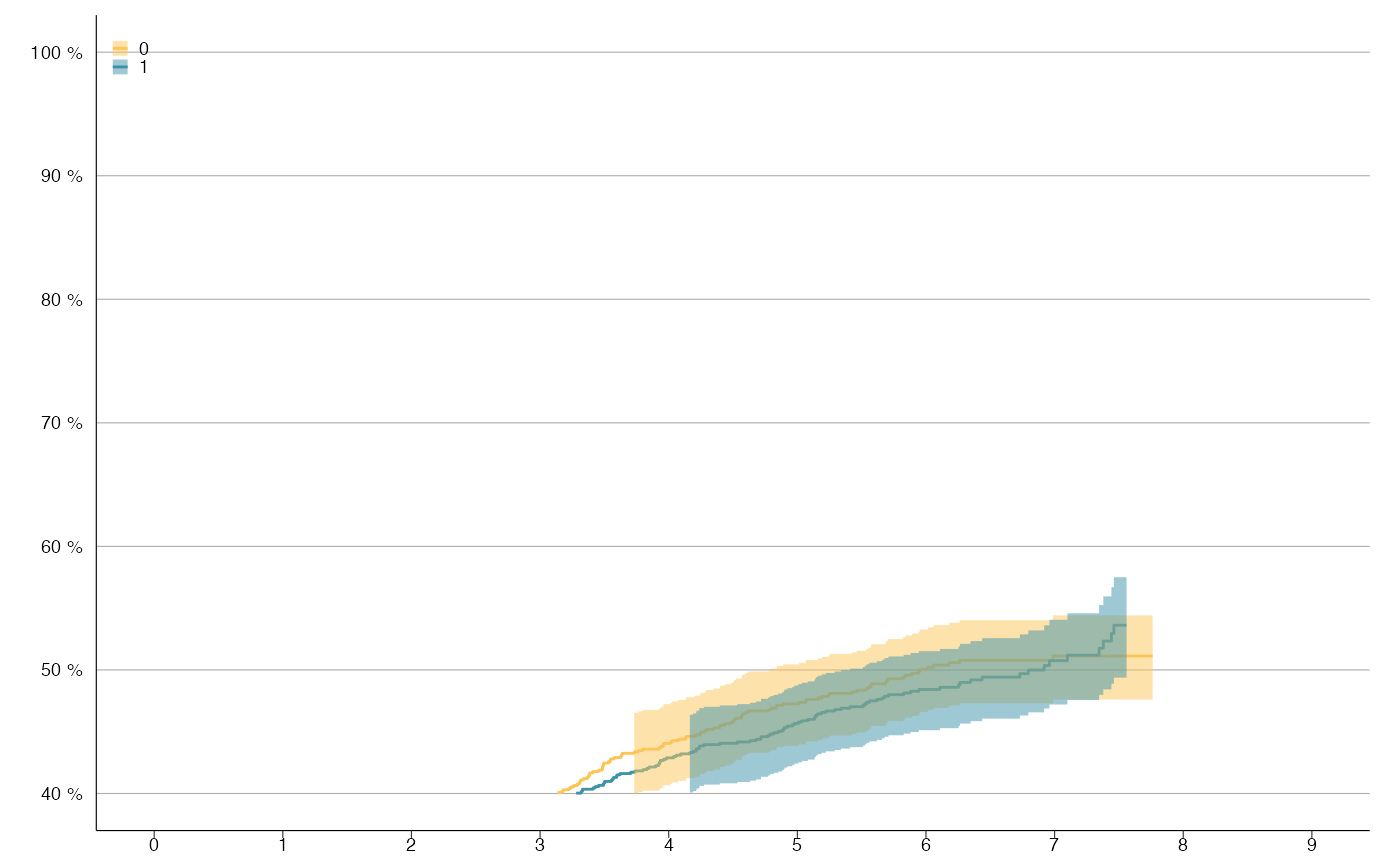
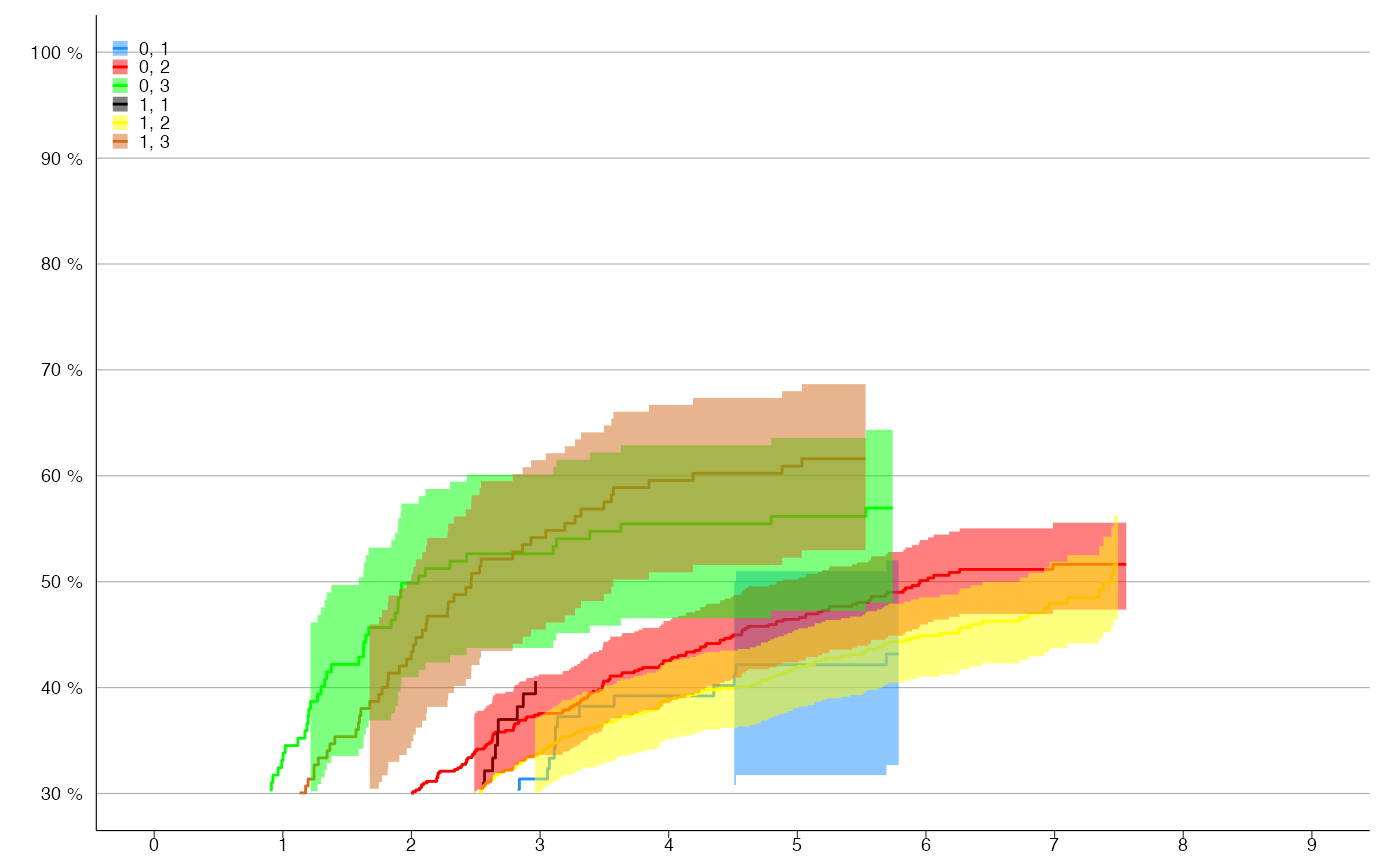
By default it plots 1-KM. Set cum_inc = FALSE to plot the survival function.
km_plot(
  survfit_obj,
  make_step = NULL,
  cum_inc = TRUE,
  first_point = 1,
  one_level = FALSE,
  y_lim = NULL,
  percent_accuracy = 1,
  y_breaks = 5,
  x_lim = NULL,
  x_breaks = 1,
  n_points = NULL,
  n_risk_break = 50,
  title = NULL,
  subtitle = NULL,
  y_lab = NULL,
  x_lab = NULL,
  line_size = 0.5,
  show_ci = TRUE,
  ribbon_ci = TRUE,
  ribbon_alpha = 0.5,
  ci_line_size = 0.2,
  line_colors = NULL,
  legend.position = c(0, 1),
  legend_labels = ggplot2::waiver(),
  label_breaks = ggplot2::waiver(),
  ...
)
Arguments
- survfit_obj
Object returned from
survival::survfit(). Also works with data frame if year and surv variable exist. lower and upper variable needed ifshow_ci = TRUE. Specify strata variable needed if several curves wanted.- make_step
If
TRUE, step data will be created.- cum_inc
If
TRUE, 1-KM is plotted.- first_point
If
make_step = TRUE,first_pointfor KM is 1 and for competing risk 0.- one_level
Boolean indicating if there is only one level in the strata.
- y_lim
Limit on y-axis.
- percent_accuracy
Set accuracy for
scales::percent_format().- y_breaks
Length between each break on y-axis.
- x_lim
Limit on x-axis.
- x_breaks
Length between each break on x-axis.
- n_points
Number of points to be plotted, useful to change if file is large because of too many points!
- n_risk_break
Minimum number at risk to include
- title
Plot title,
NULLfor no title.- subtitle
Small text under title,
NULLfor no subtitle.- x_lab, y_lab
X- and Y-axis labels.
- line_size
Size of the head lines.
- show_ci
If
TRUE, show confidence interval lines.- ribbon_ci
Show confidence interval
- ribbon_alpha
Degree of transparency for confidence interval
- ci_line_size
Size of the confidence interval lines.
- line_colors
Color of the different curves.
- legend.position
Position of the legend in plot.
- legend_labels
Label for each legend key, default order as they appear in
names(survfit_obj$strata).- label_breaks
Order of the legend keys.
- ...
arguments passed to
theme_slr()
Value
ggplot object containing Kaplan-Meier plot.
Examples
library(survival)

# KM-plot with 2 levels
survfit_obj <- survfit(Surv(time / 365.24, status) ~ sex, survival::colon)
km_plot(survfit_obj, y_lim = c(40, 100), y_breaks = 10, x_lim = c(0, 9))
#> Warning: Removed 1264 row(s) containing missing values (geom_path).


# KM-plot with 6 levels
survfit_obj <- update(survfit_obj, . ~ . + differ)
km_plot(survfit_obj, y_lim = c(30,100), y_breaks = 10, x_lim = c(0,9),
  line_colors = c('dodgerblue', 'red', 'green', 'black', 'yellow', 'chocolate'))
#> Warning: Removed 1000 row(s) containing missing values (geom_path).
#> Warning: no non-missing arguments to max; returning -Inf
