Plot an age pyramid using ggplot2.
age_pyramid(
  df,
  age_var = "Alder",
  gender_var = "Kon",
  man_level = "Man",
  age_breaks = c(0, 39, 44, 49, 54, 59, 64, 69, 74, 79, 84, Inf),
  age_labels = c("0-39", "40-44", "45-49", "50-54", "55-59", "60-64", "65-69", "70-74",
    "75-79", "80-84", "85+"),
  percent = TRUE,
  x_breaks = 5,
  x_breaks_end = x_breaks * 1e+05,
  title = "",
  subtitle = NULL,
  y_lab = NULL,
  x_lab = NULL,
  fill_colors = slr_colors(2),
  legend.position = c(0, 0),
  legend_labels = ggplot2::waiver(),
  label_breaks = ggplot2::waiver(),
  legend_row = NULL,
  legend_col = NULL,
  ...
)
Arguments
- df
Data frame.
- age_var
Name of age variable.
- gender_var
Name of gender variable.
- man_level
Name of man level, probably "Man" or "Män".
- age_breaks
Each age observation in an interval.
- age_labels
Label of the interval.
- percent
If
TRUE, x-axis is in percent form. Otherwise in count form.- x_breaks
Length between each break on x-axis.
- x_breaks_end
Break end, default for 100,000. Works for all count values below that.
- title, subtitle
Plot title/subtitle,
NULLfor no title.- x_lab, y_lab
X/Y-axis labels, use
NULLfor no label.- fill_colors
Colors of the genders.
- legend.position
Position of the legend in plot, if
c(1,1),c(1,0)etc, legend inside plot.- legend_labels
Label for each legend key.
- label_breaks
Order of the legend keys.
- legend_row, legend_col
How many rows/columns for the legends.
- ...
arguments passed to
theme_slr()
Value
ggplot object containing age pyramid plot.
Examples
# Creating data
set.seed(123)
df <- data.frame(age = rpois(100000, 65),
gender = sample(c('Woman', 'Woman', 'Man'), 100000, replace = TRUE))
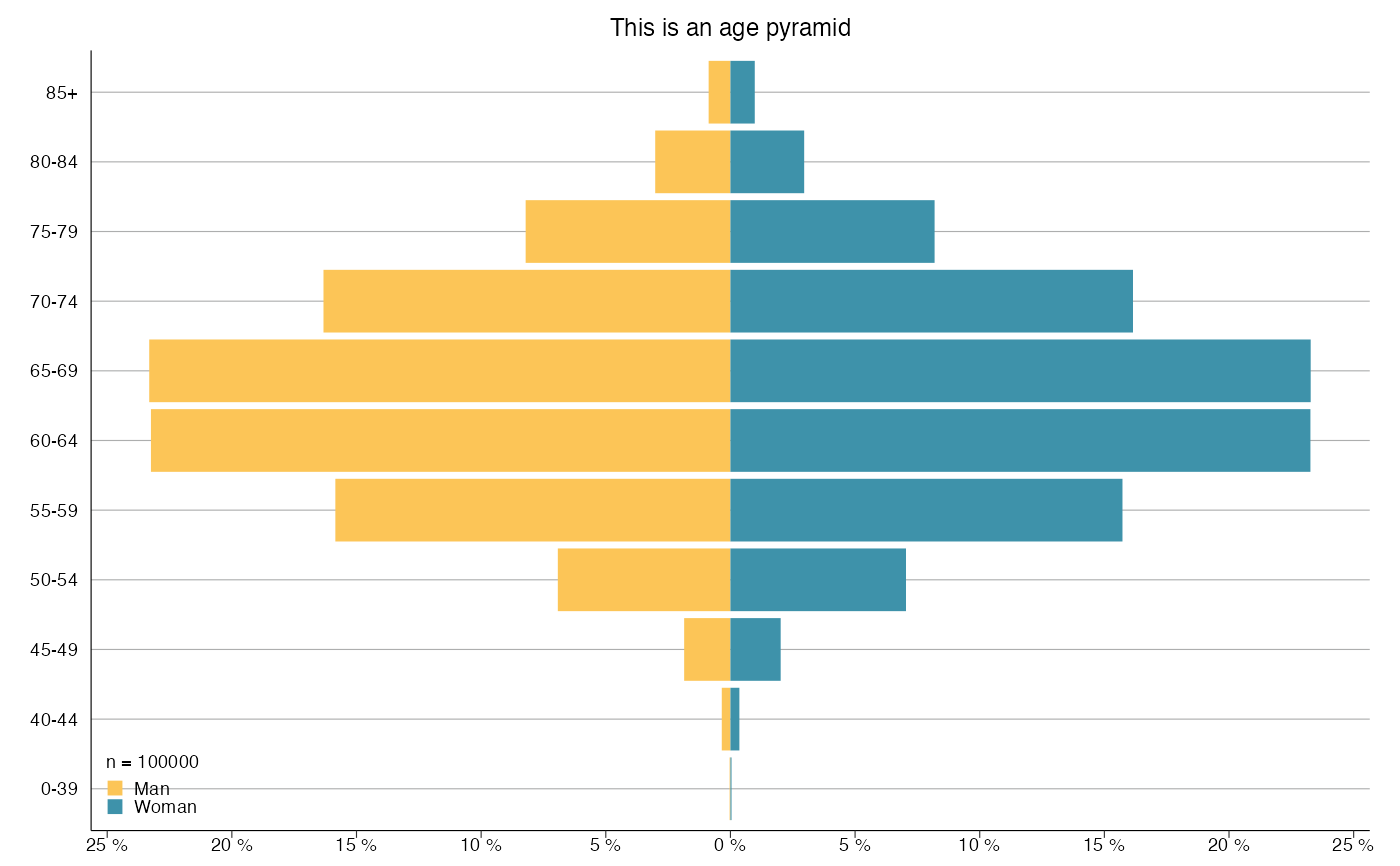
# Age pyramid
age_pyramid(df, age_var = 'age', gender_var = 'gender',
man_level = 'Man', title = "This is an age pyramid")
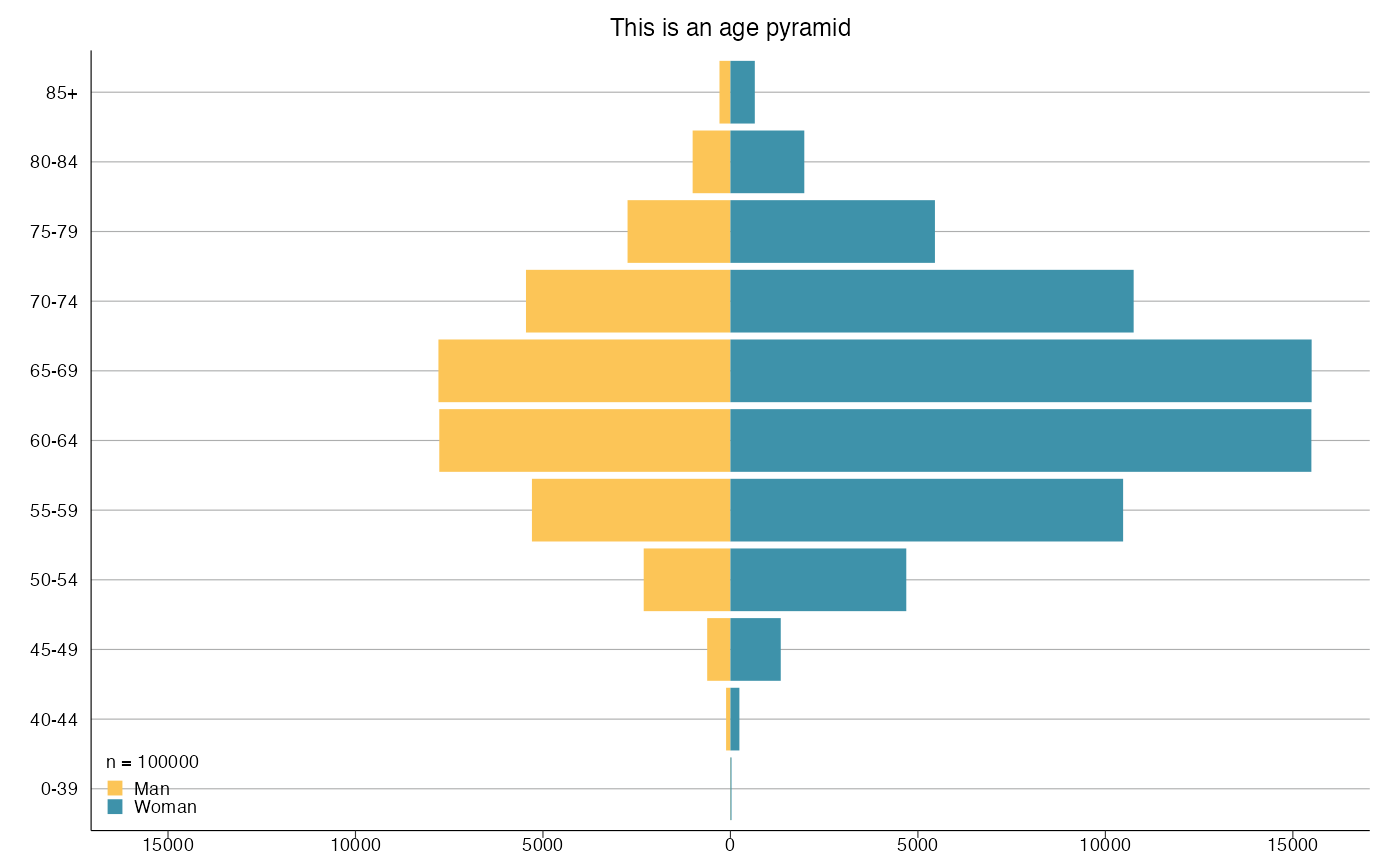
 # Age pyramid with percent = FALSE
age_pyramid(df, age_var = 'age', gender_var = 'gender',
man_level = 'Man', percent = FALSE, x_breaks = 5000,
title = "This is an age pyramid")
# Age pyramid with percent = FALSE
age_pyramid(df, age_var = 'age', gender_var = 'gender',
man_level = 'Man', percent = FALSE, x_breaks = 5000,
title = "This is an age pyramid")