Sweden map data set
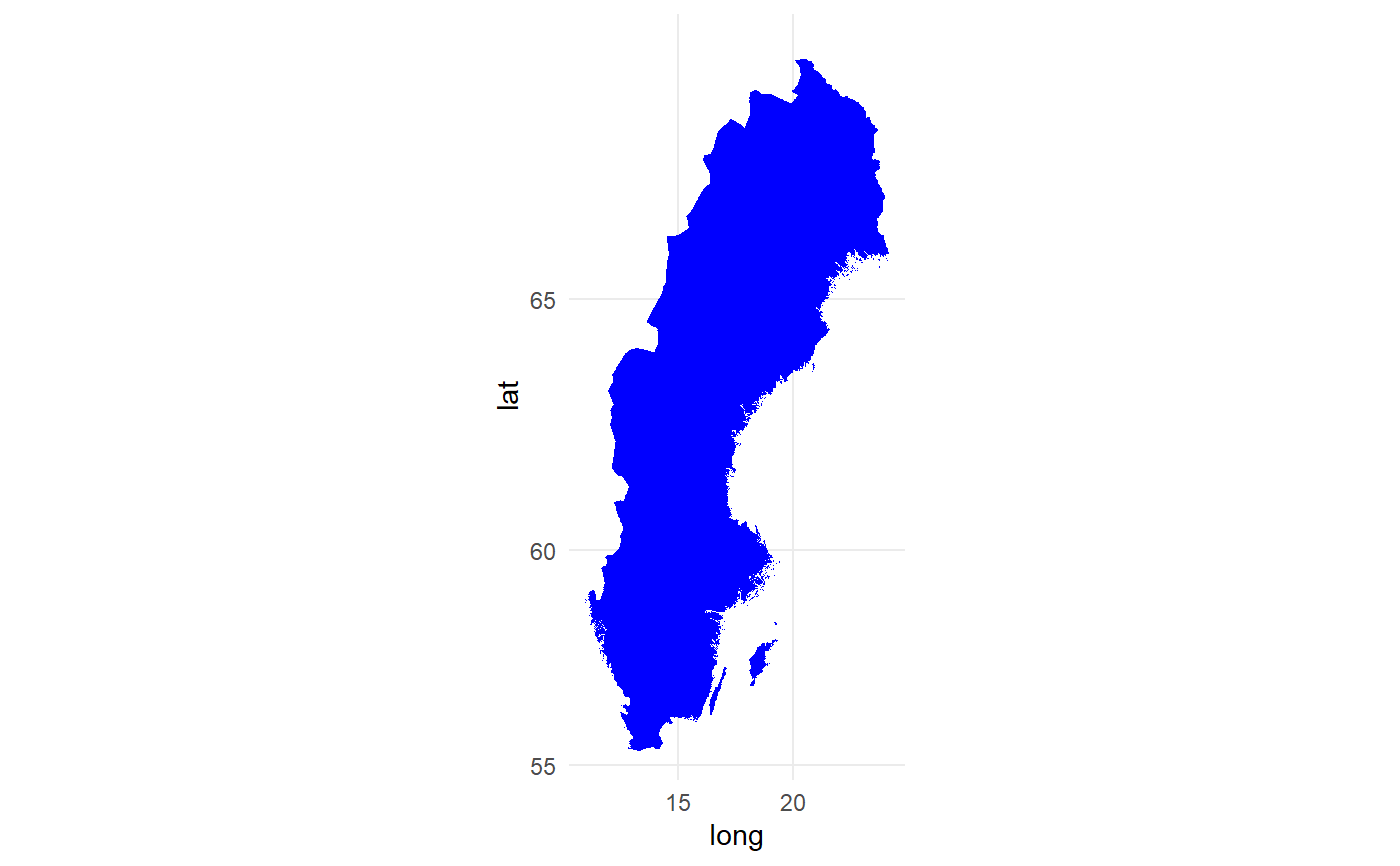
swe_allpoints.RdA dataset used to create elegant figures of Sweden with ggplot2.
swe_allpoints
Format
A data frame with 407898 rows and 5 variables. The negligible variables with just one type of observation have been removed from the original data set:
- long
longitude, numeric
- lat
latitude, numeric
- order
specifies the order for each point, integer
- piece
"1" if point belongs to mainland, "2" if point belongs to Gotland (largest island in Sweden), "3" if point belongs to Öland, "4" if point belongs to Orust or Tjörn, "5" if point belongs to Fårö, everything else if point belongs to any other smaller island, factor
- group
Each region in the map is a polygon where "1.1" if point belongs to mainland, "1.2" if point belongs to Gotland (largest island in Sweden), "1.3" if point belongs to Öland, "1.4" if point belongs to Orust or Tjörn, "1.5" if point belongs to Fårö, everything else if point belongs to any other smaller island, factor
Examples
# Example on how to make map of Sweden using ggplot2.
# Note that coord_map() is essential for the map to be in actual scale.

ggplot2::ggplot(data = swe_allpoints, ggplot2::aes(x=long, y=lat, group = group)) +
  ggplot2::geom_polygon(color = "transparent", fill = "blue")  +
  ggplot2::coord_map() +
  ggplot2::theme_minimal()
