Compass riket plot function
compass_riket.RdRadar plot with axis names using ggplot2.
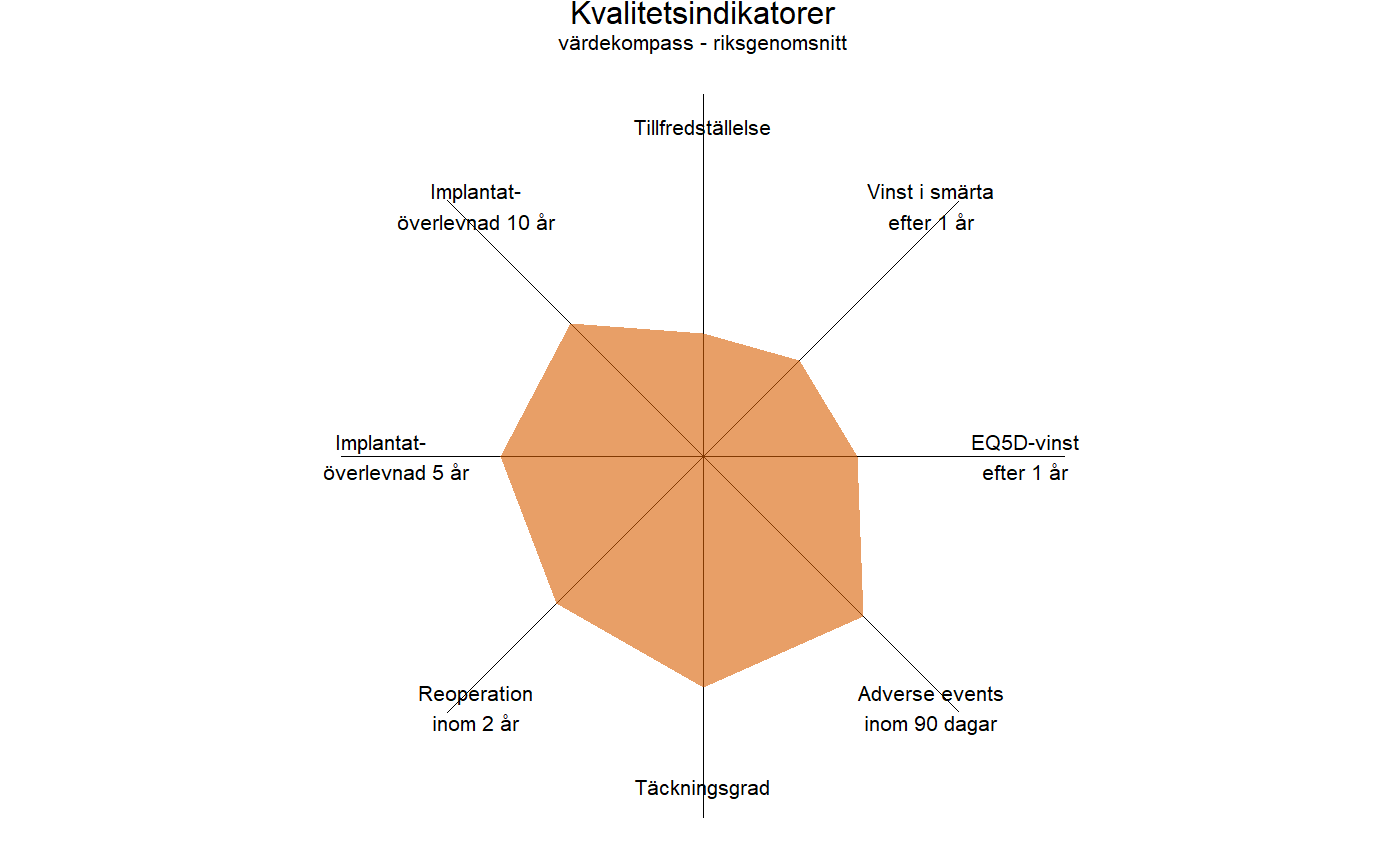
compass_riket(
  df,
  riket_name = "Riket",
  axis_titles = names(df)[-1],
  poly_color = "#D95F02",
  color_alpha = 0.6,
  title = "Kvalitetsindikatorer",
  subtitle = "värdekompass - riksgenomsnitt",
  title_size = 12,
  subtitle_size = 8,
  axis_text_size = 8,
  line_size = 0.1,
  axis_text_position = 1,
  v_just = "outward",
  h_just = "middle"
)
Arguments
| df | Data frame. |
|---|---|
| riket_name | Hos to adress the nation. |
| axis_titles | Titles on the axis, character vector works. |
| poly_color | Color of the polygon. |
| color_alpha | Modify color transparency for polygon color. Should be the same as alpha_riket for function compass. |
| title | Title of the compass, use NULL for no title. |
| subtitle | Small text under the title, use NULL for no subtitle. |
| title_size | Text size of title in pt. |
| subtitle_size | Text size of subtitle in pt. |
| axis_text_size | Text size of axis titles in pt. |
| line_size | Size of the lines in the choord, useful to change if large dpi! |
| axis_text_position | Where the text is on the axis. |
| v_just | Vertical adjustments to the text on the axis, "outward" is default means text is aligned away from the center. |
| h_just | Horizontal adjustments to the text on the axis, "middle" is default. |
Value
ggplot object containing compass plot of Swedish average with text on the axis.
Examples
# Create one Swedish average compass with normalized data

axis_titles <- c(
  "Tillfredst\u00E4llelse",
  "Vinst i sm\u00E4rta\nefter 1 \u00E5r",
  "EQ5D-vinst\nefter 1 \u00E5r",
  "Adverse events\ninom 90 dagar",
  "T\u00E4ckningsgrad",
  "Reoperation\ninom 2 \u00E5r",
  "Implantat-\n     \u00F6verlevnad 5 \u00E5r",
  "Implantat-\n\u00F6verlevnad 10 \u00E5r"
)

compass_riket(norm_compass_data, axis_titles = axis_titles)