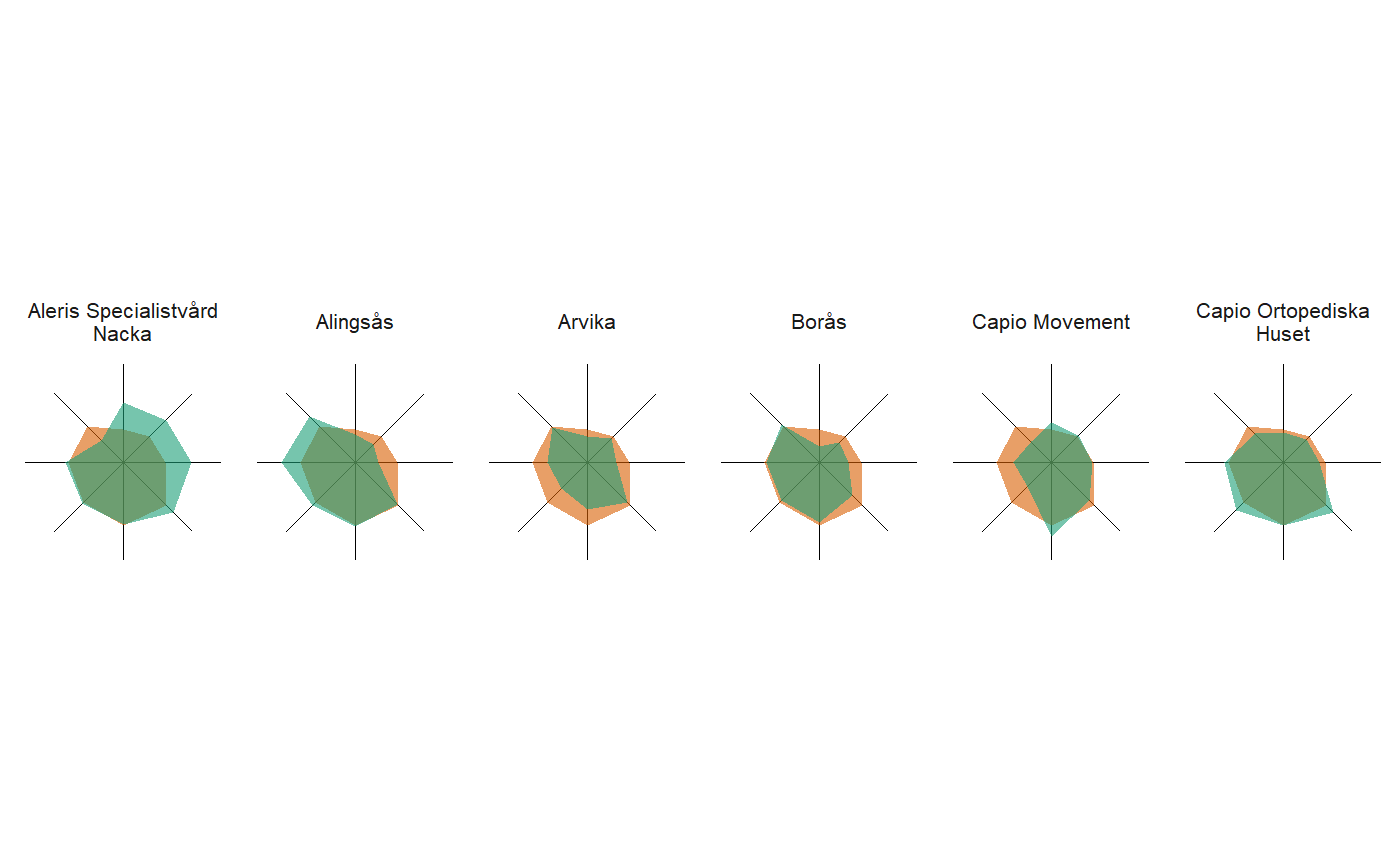
Compass plot function
compass.RdRadar plot using ggplot2.
compass(
  df,
  riket_name = "Riket",
  ncol = 6,
  riket_color = "#D95F02",
  hosp_color = "#1B9E77",
  alpha_riket = 0.6,
  alpha_hosp = 0.6,
  titles = NULL,
  title_size = 8,
  line_size = 0.1
)
Arguments
| df | Data frame. |
|---|---|
| riket_name | Character to find what row is Swedish average, usually named "Riket". |
| ncol | Number of plots on each row. |
| riket_color | Color of Swedish average polygon. |
| hosp_color | Color of hospital polygon. |
| alpha_riket | Modify color transparency for Swedish average color. Use < 1 if colors are to be mixed. |
| alpha_hosp | Modify color transparency for hospital color. Use < 1 if colors are to be mixed. |
| titles | Character vector containing compass titles. |
| title_size | Text size of title in pt. |
| line_size | Size of the lines in the choord, useful to change if large dpi! |
Value
Ggplot object containing plot of compass or many compasses.