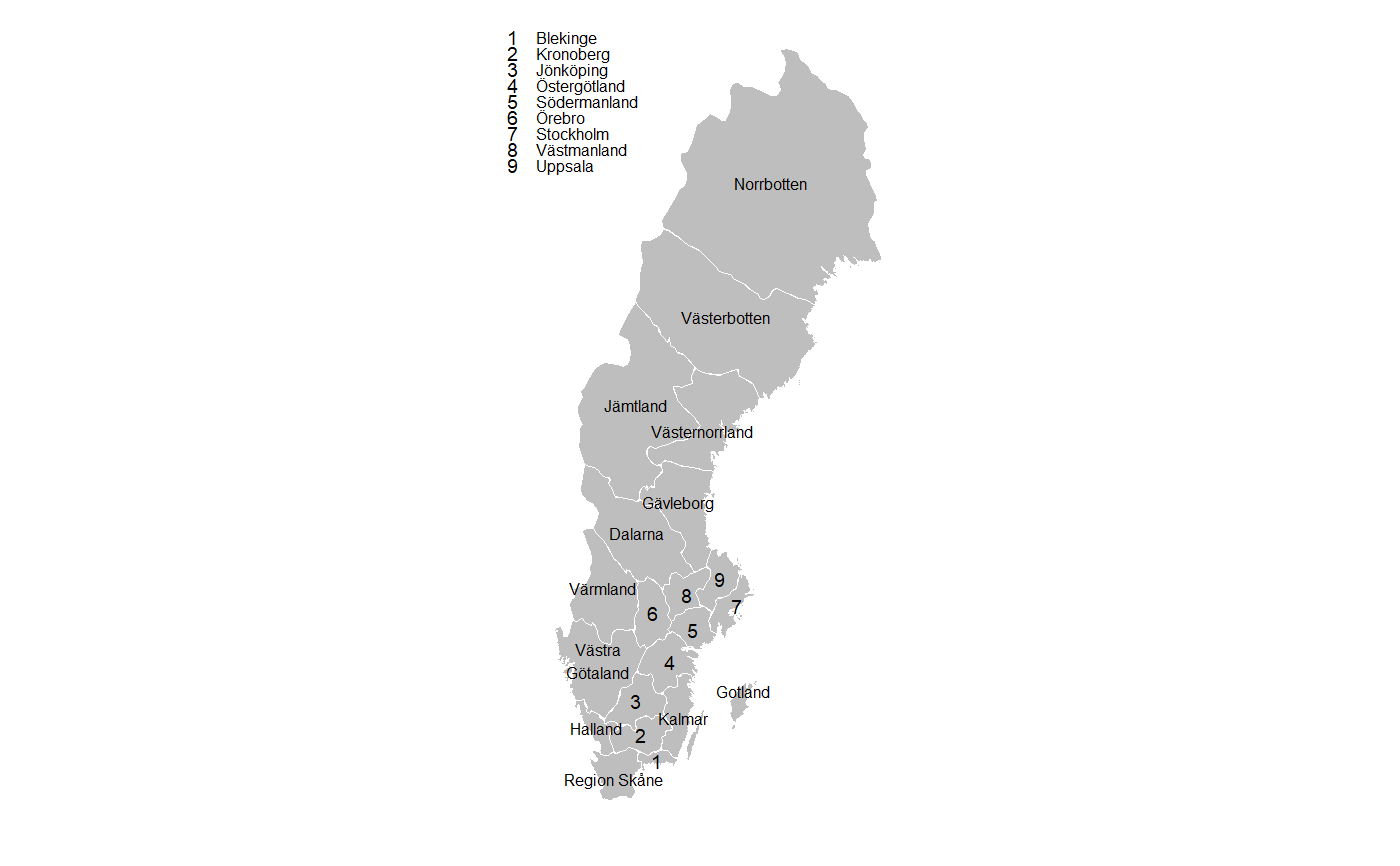
Data set used for example purposes (see examples and description in swe_landsting)
cnames1.RdData set used for example purposes (see examples and description in swe_landsting)
cnames1
Format
A data frame with 9 rows and 3 variables. The negligible variables have been removed from the original data set:
- NAME_1
name of county, character
- long
longitude, numeric
- lat
latitude, numeric
Examples
# Example on how to make map of Sweden using ggplot2.
# Note that coord_map() is essential for the map to be in actual scale.

ggplot2::ggplot(
  data = swe_landsting,
  ggplot2::aes(x=long, y=lat, group = group)
) +
ggplot2::geom_polygon(color = "white", size = 0, fill = "grey")  +
ggplot2::geom_point(
  data = cnames1,
  ggplot2::aes(x = long, y = lat, group = NAME_1, shape = NAME_1),
  size = 6*0.352777778,
  color = "black"
) +
ggplot2::scale_shape_manual(
  values = as.character(1:9),
  guide = ggplot2::guide_legend(ncol = 1)
) +
ggplot2::geom_text(
  data = cnames2,
  ggplot2::aes(x = long, y = lat, group = NAME_1,
  label = as.character(NAME_1)),
  size = 6*0.352777778,
  color = "black",
  hjust = 0.5
) +
ggplot2::coord_map() +
ggplot2::theme_minimal() +
ggplot2::xlab("") +
ggplot2::ylab("") +
ggplot2::theme(
  plot.title           = ggplot2::element_blank(),
  axis.text            = ggplot2::element_blank(),
  axis.title.x         = ggplot2::element_text(size = 8, color = "black"),
  axis.title.y         = ggplot2::element_text(size = 8, color = "black"),
  panel.grid           = ggplot2::element_blank(),
  panel.background     = ggplot2::element_blank(),
  axis.ticks           = ggplot2::element_blank(),
  legend.text          = ggplot2::element_text(size = 6),
  legend.title         = ggplot2::element_blank(),
  legend.key.height    = ggplot2::unit(6, "pt"),
  legend.key.width     = ggplot2::unit(6, "pt"),
  legend.position      = c(-0.13,1),
  legend.justification = c(0,1),
  plot.margin          = ggplot2::margin(0,0,0,0, unit = "cm")
)
